————— Draw By Number
Undergraduate BArch Thesis
Machine learning allows us to generate representational images and texts in new ways, based not on projections or formulaic operations, but rather on a statistical relationship created by a data set consisting of thousands of architectural projects. This approach allows design bias to be investigated and controlled in new ways. This thesis project consists of two parts: first, it assembles a data set of architectural drawings; second, it creates tools for use in the design process.
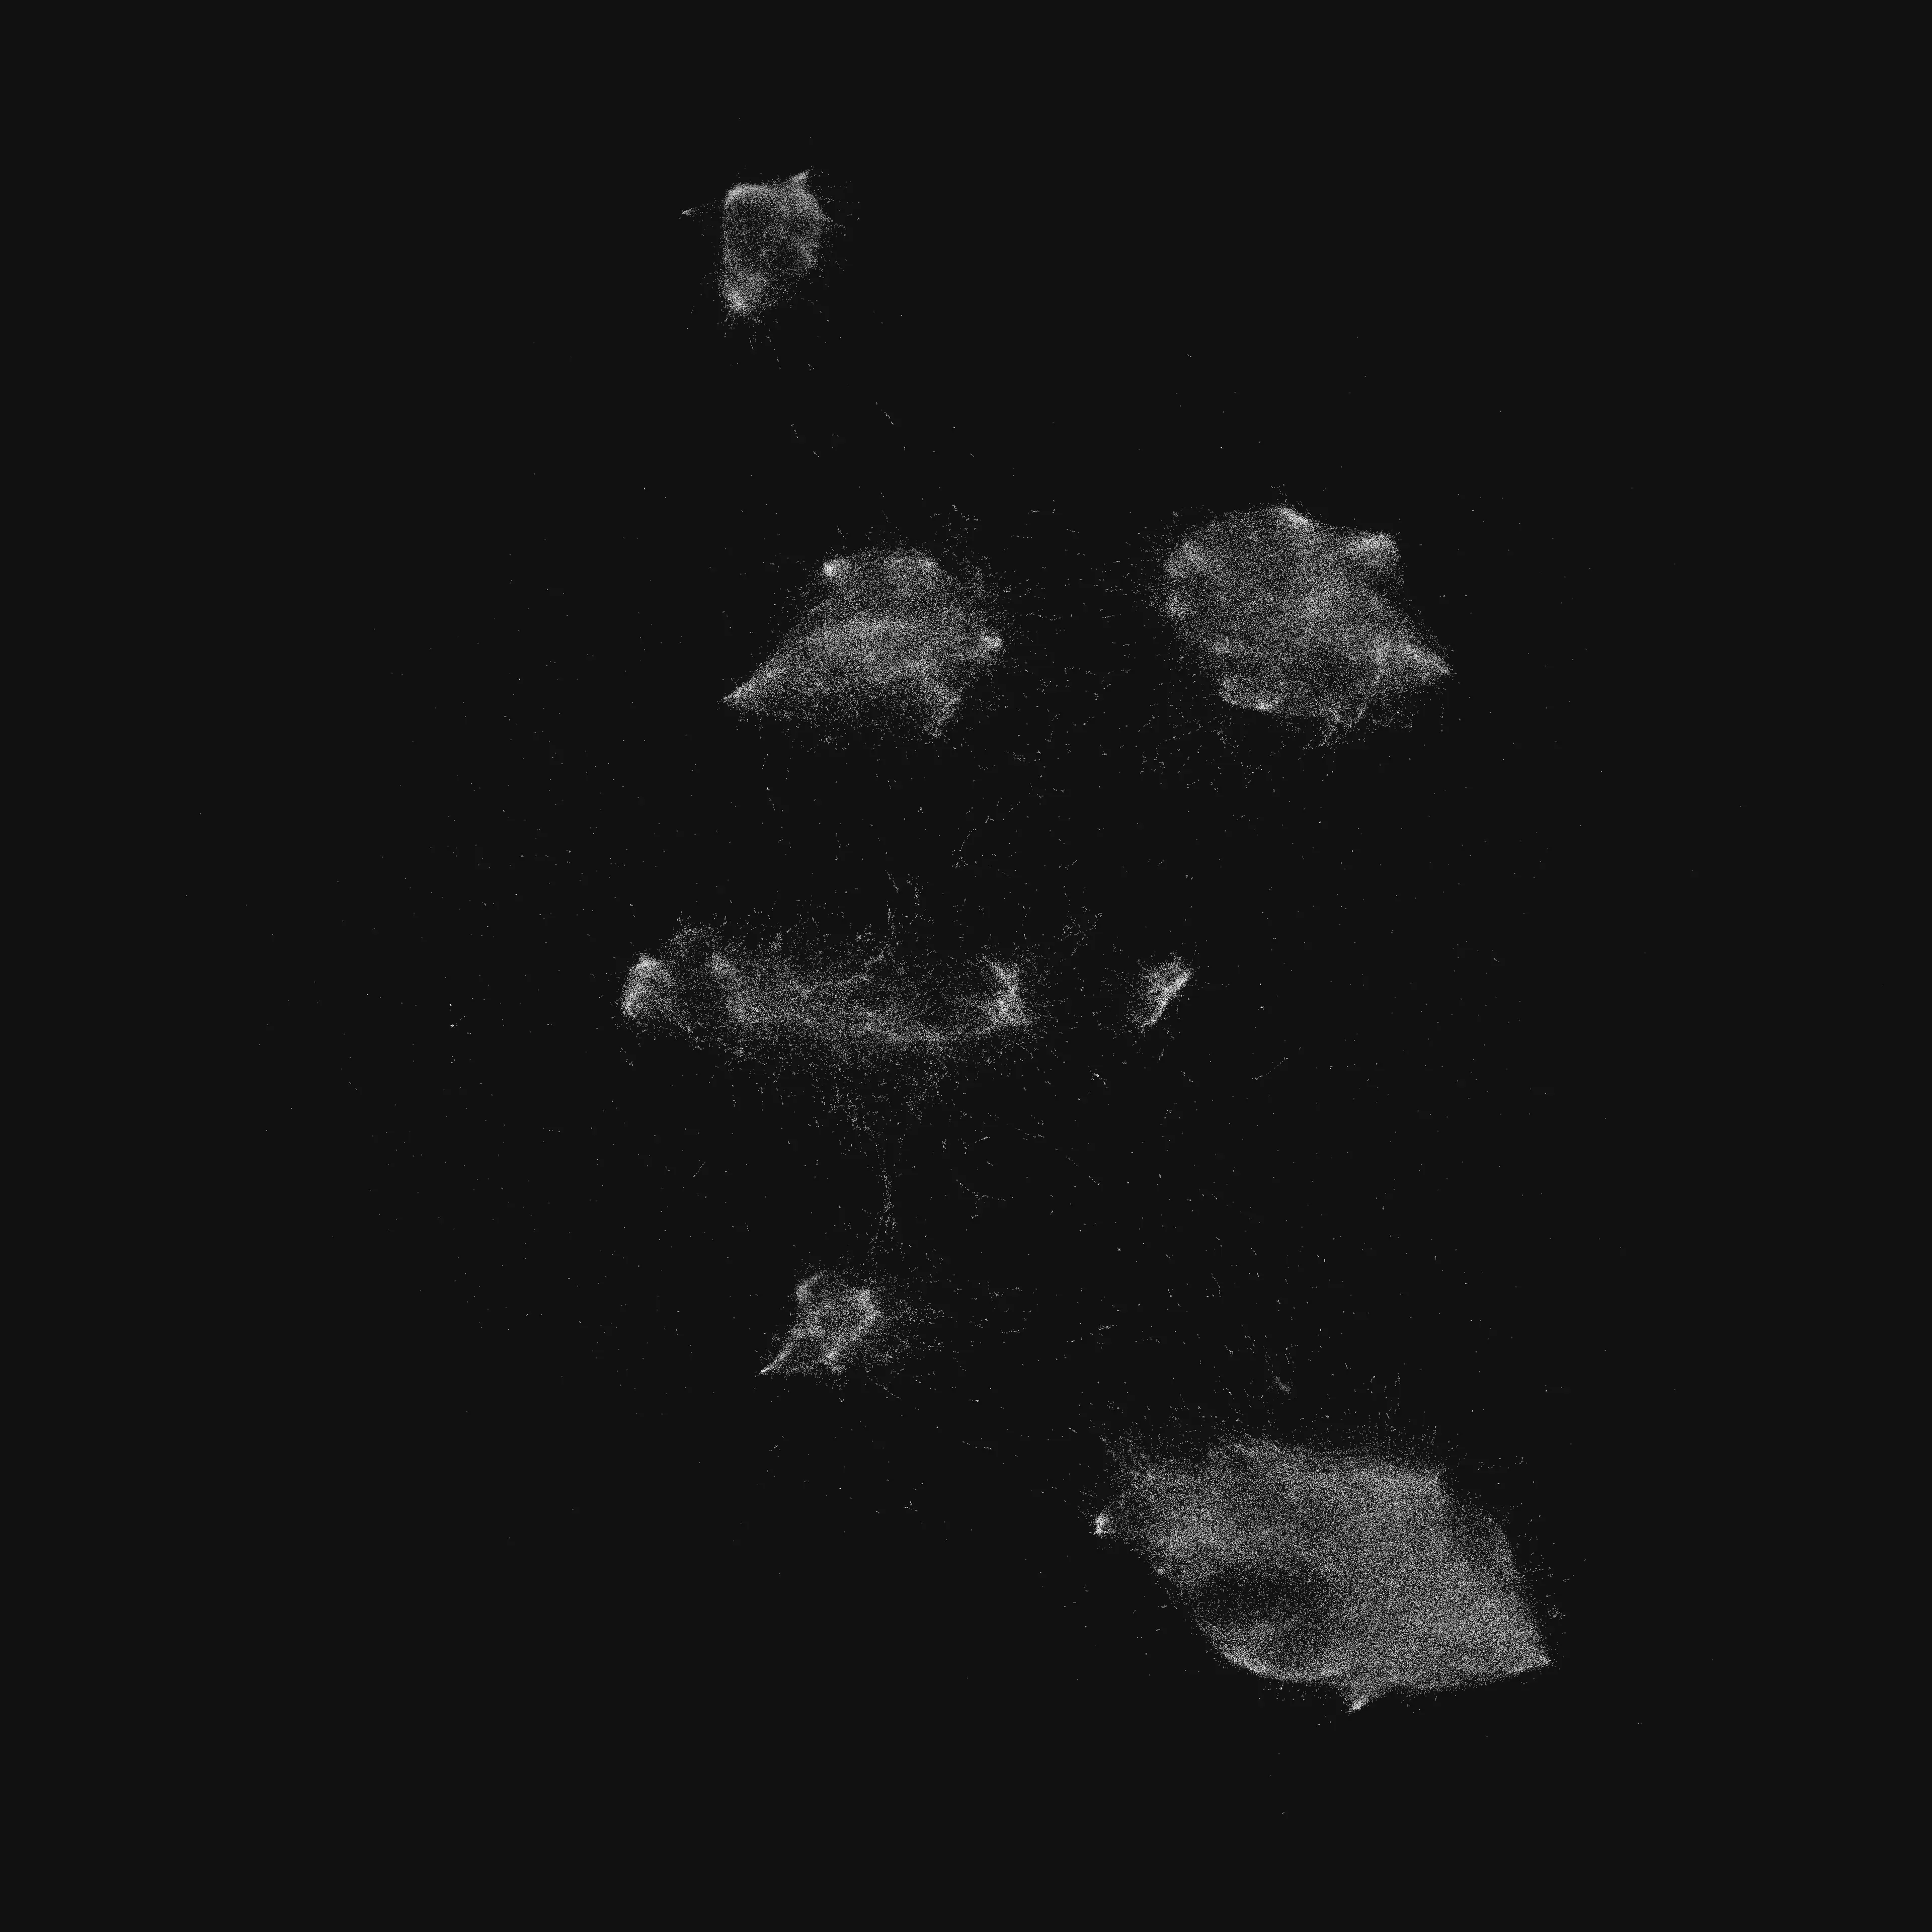
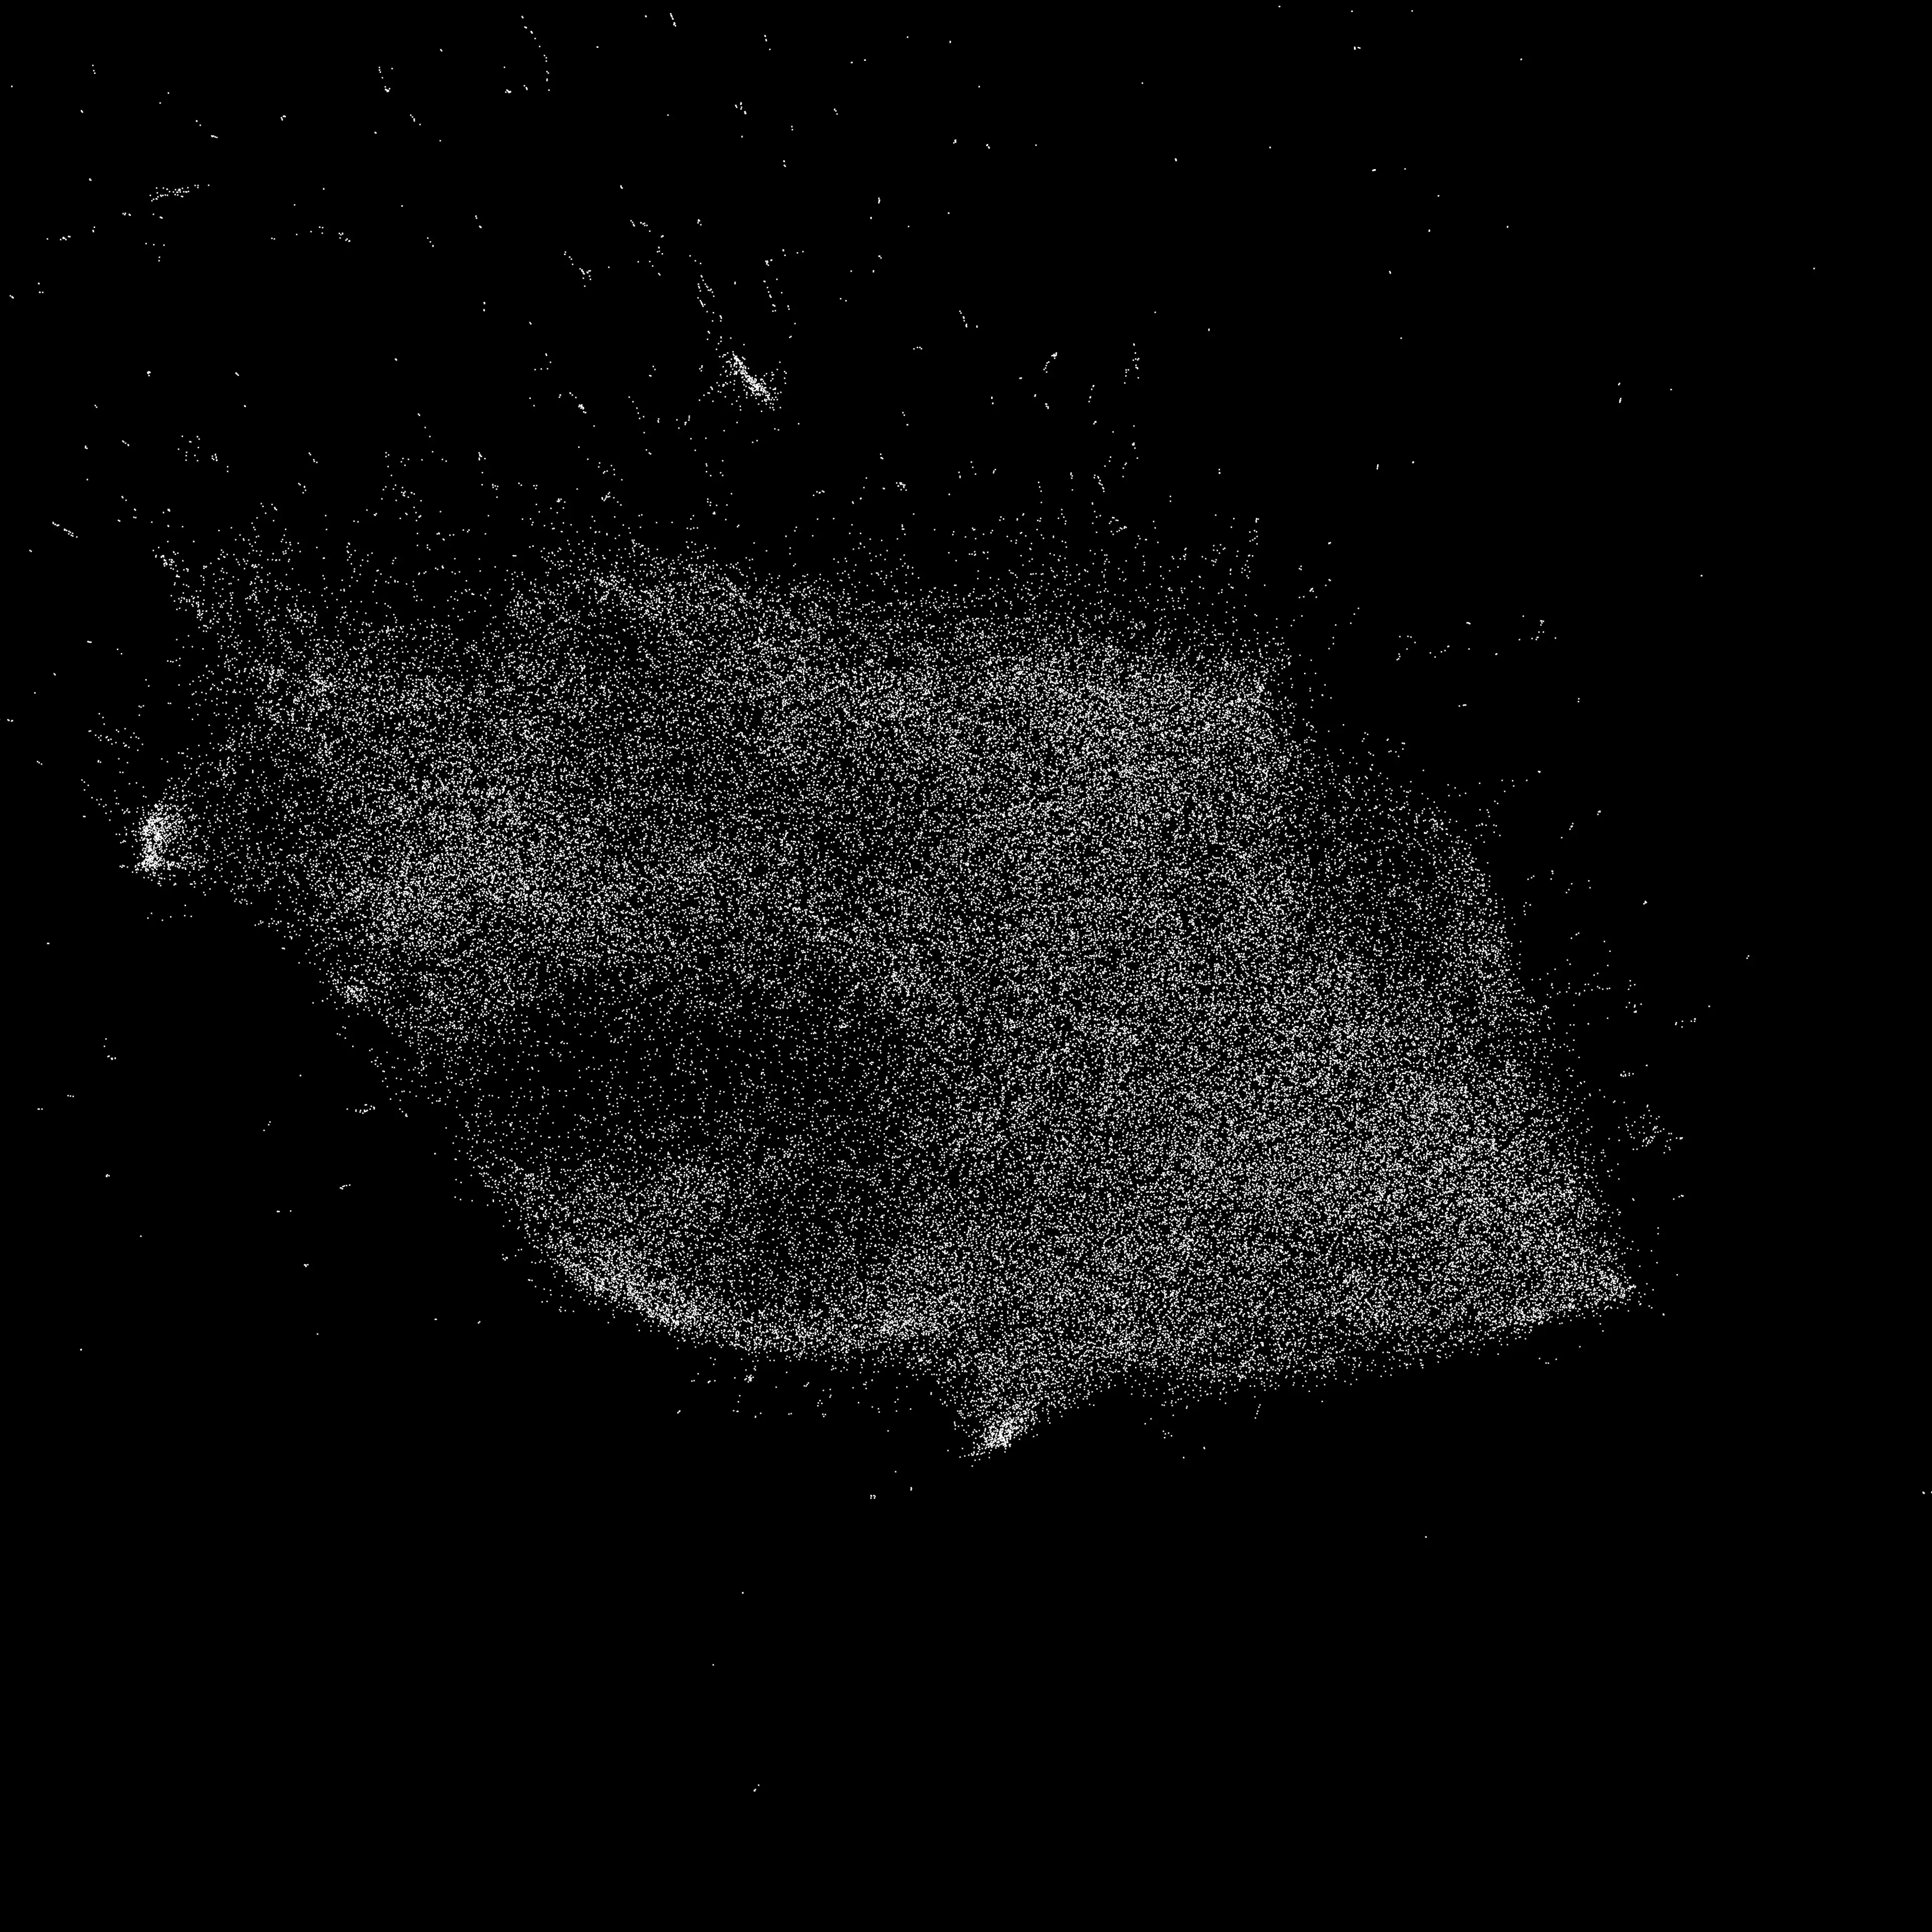
The data set used in this project consists of 225,000 drawings scraped from architectural periodicals, primarily from ArchDaily. An interactive visualization is available below. Since every data set is subject to bias, drawing tools created from data sets will reflect these biases. For example, ArchDaily has publishing protocols that link each project drawing with a manufacturer to advertise products; it publishes more houses than any other program type, and most projects originate from the US, Europe, and China—very few are sited elsewhere.I have created two drawing tools available below: one generates a novel architectural drawing from a text caption. The other allows control over image properties across the most visually apparent changes in the dataset, such as drawing type, poche, rotation, and image size. This list can be expanded to any categorizable visual difference.——— Visualizations of the most apparent latent dimensions in the model
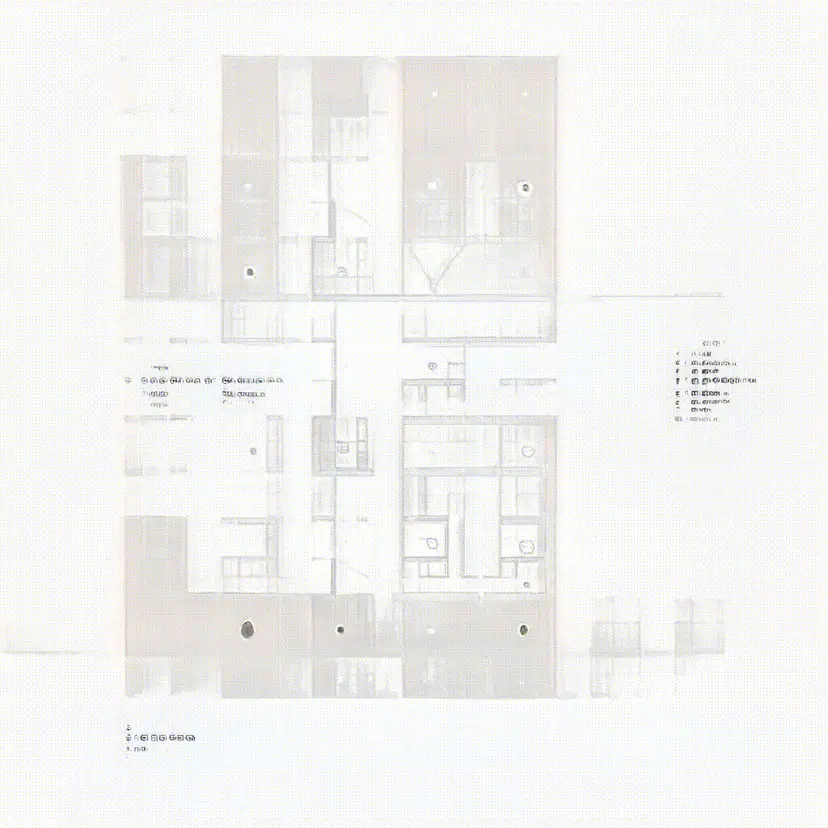
Outline - Poche
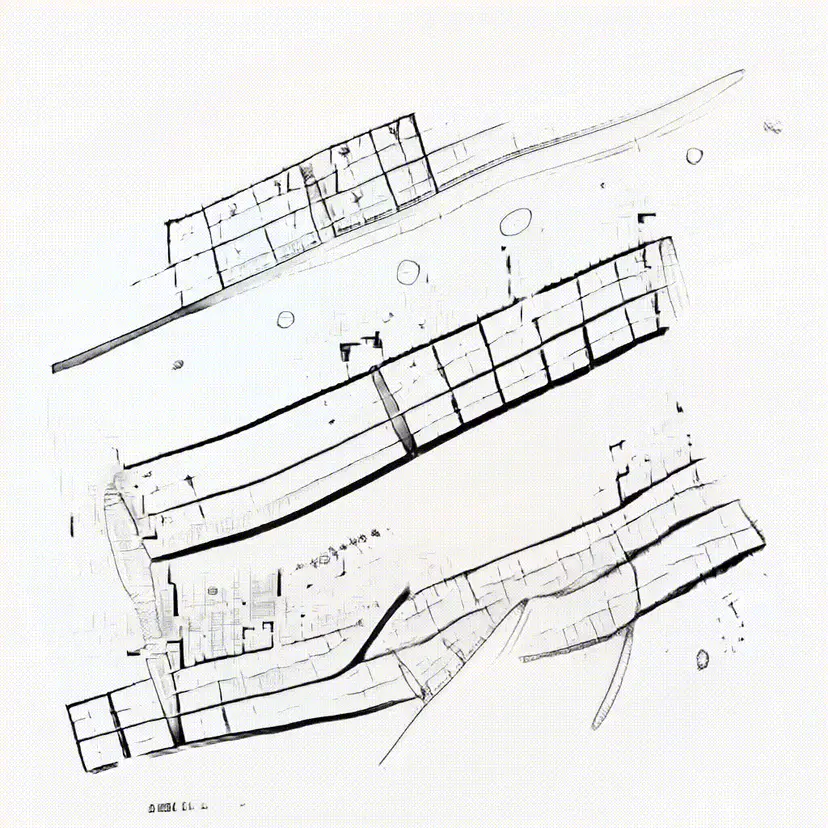
Site - Drawing

Elevation - Plan
——— Results of the image editing tool
-384.webp)
-384.webp)
-384.webp)
-384.webp)
-384.webp)
-384.webp)
-384.webp)
-384.webp)
-384.webp)
-384.webp)
-384.webp)
-384.webp)
-384.webp)
-384.webp)
-384.webp)
-384.webp)
-384.webp)
-384.webp)
-384.webp)
-384.webp)
-384.webp)
-384.webp)
-384.webp)
-384.webp)
——— Results of the Text Generation tool
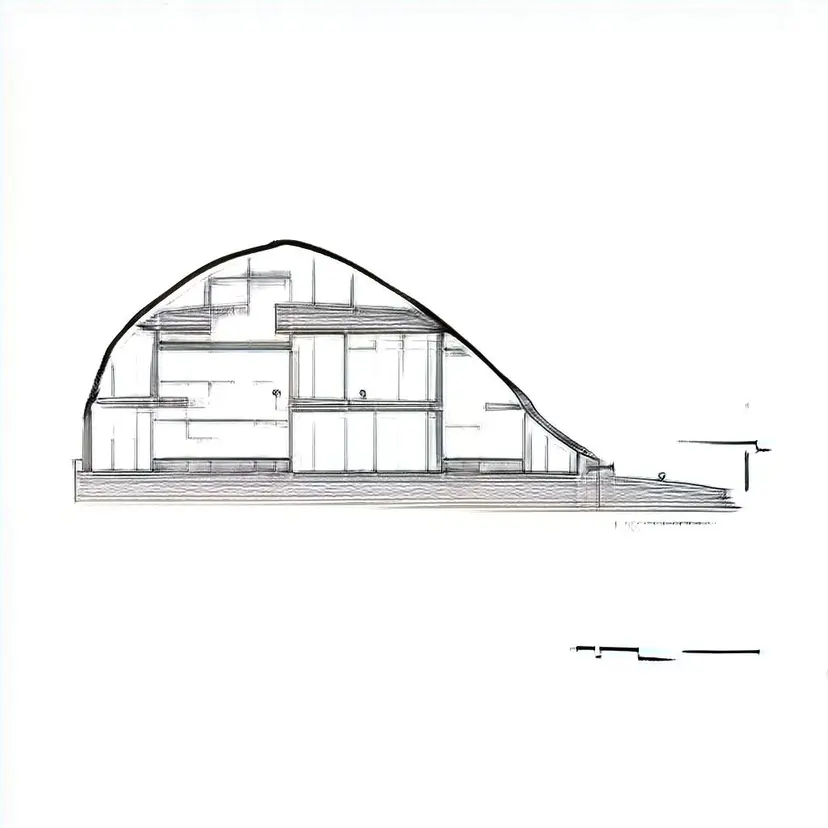
"house in the shape of a circle"
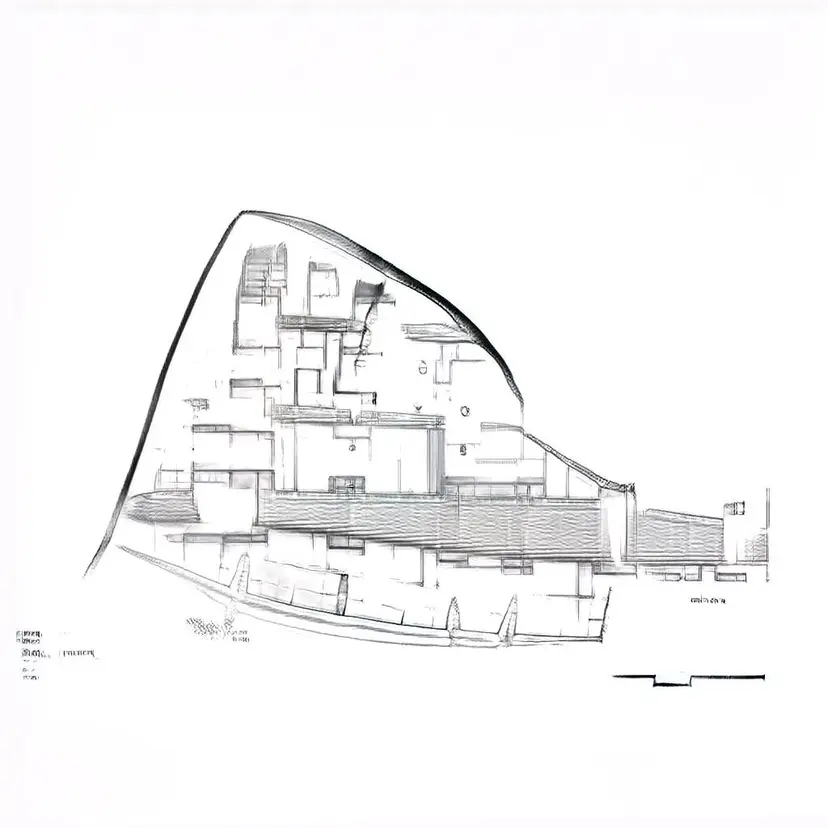
"large apartment complex in a landscape"
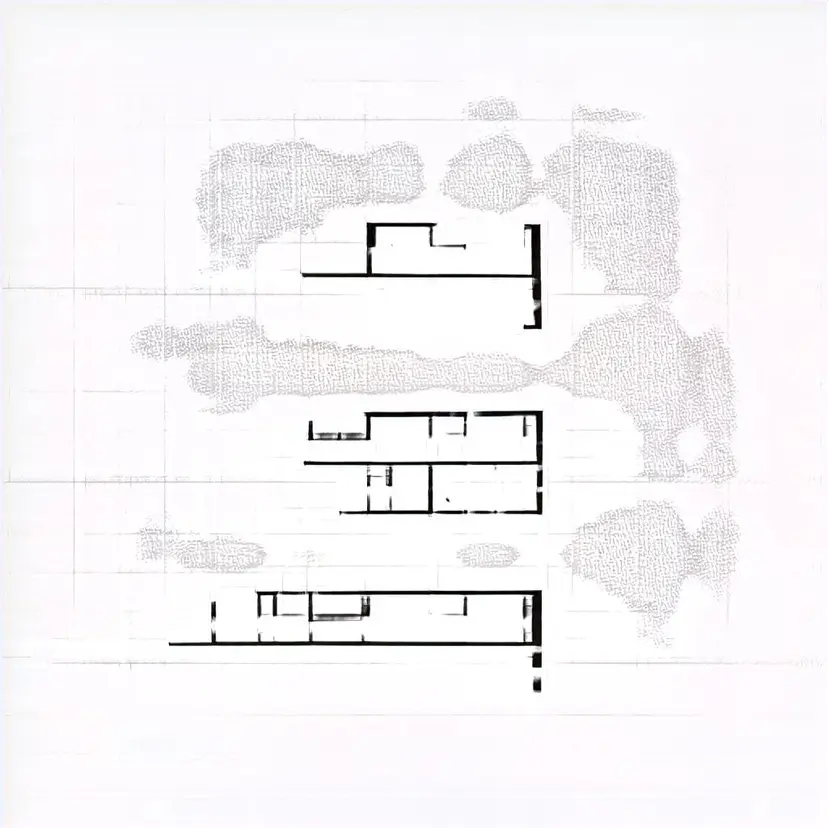
"home with timber supports, courtyard and garden"
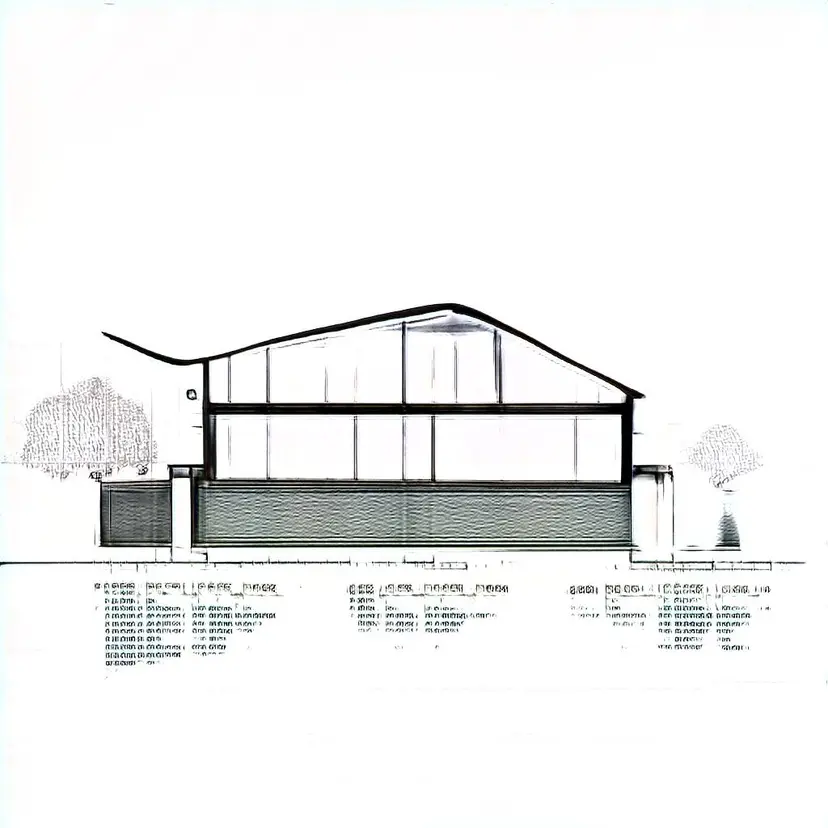
"house made with steel"
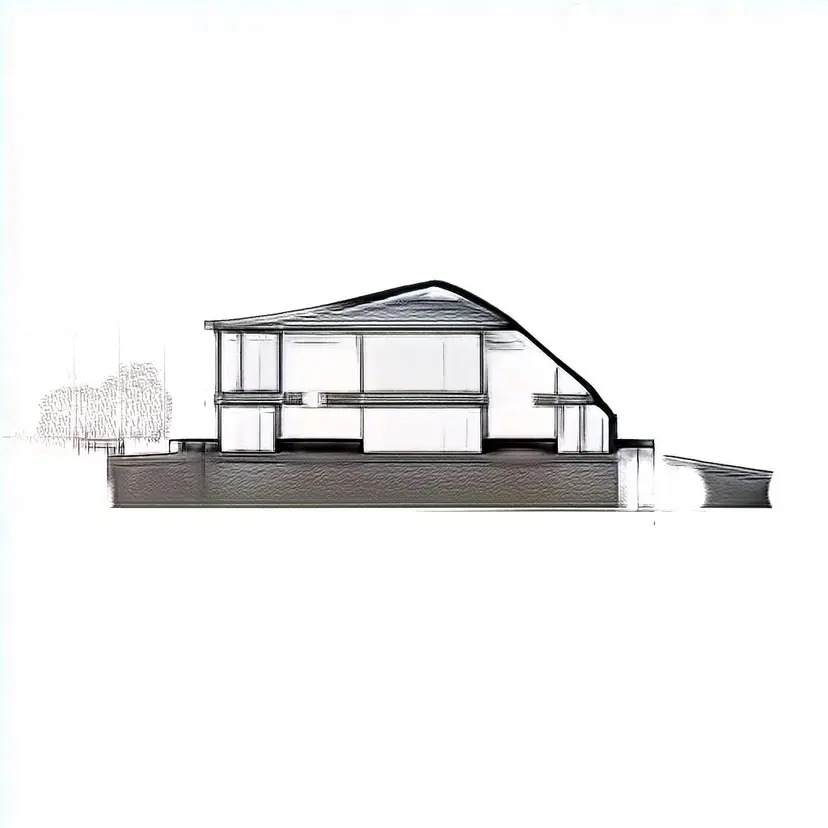
"house made with concrete"
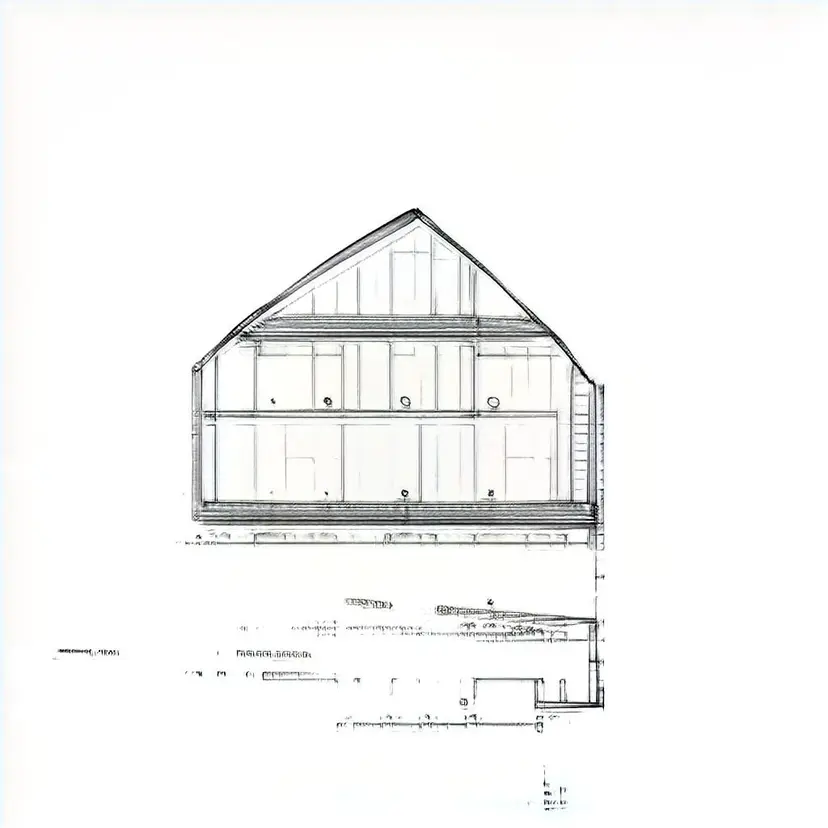
"house made with timber"

"the best drawing"
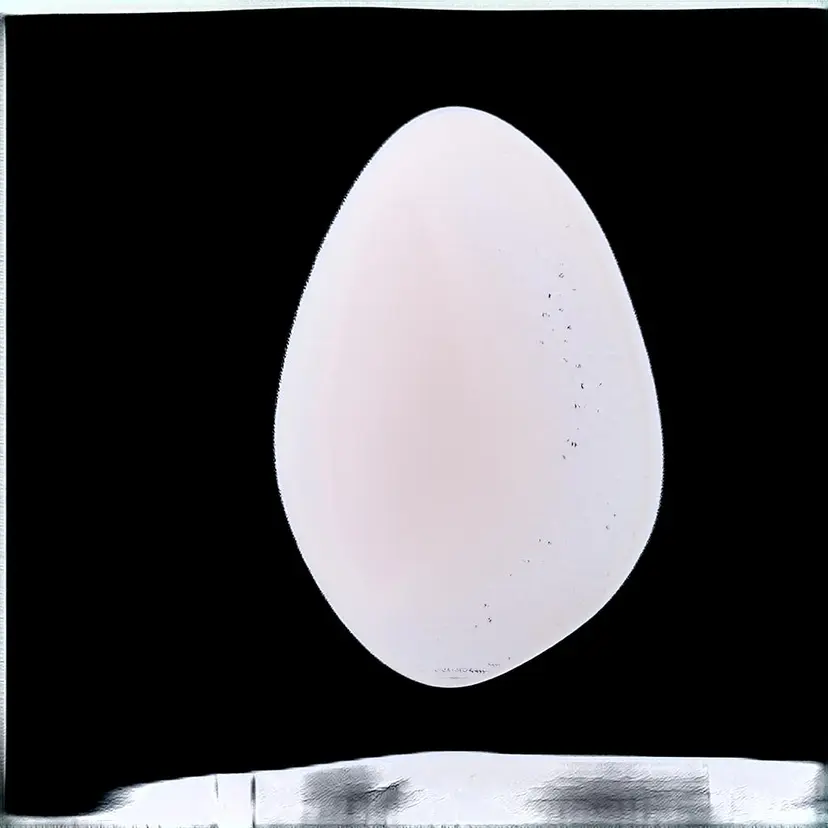
"egg"
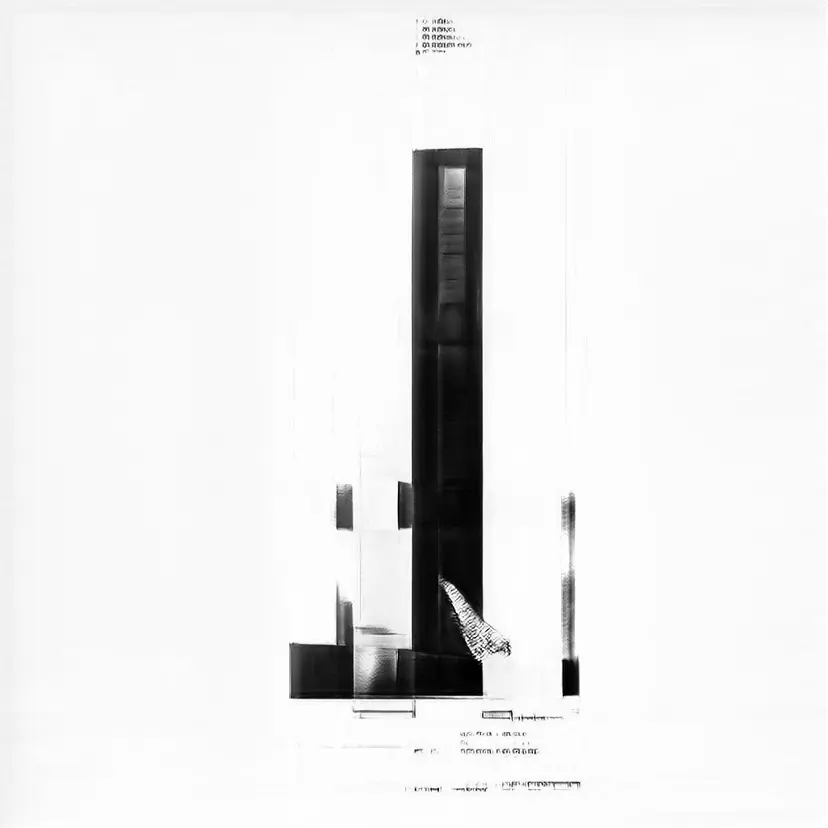
"skyscraper"
——— Notable results
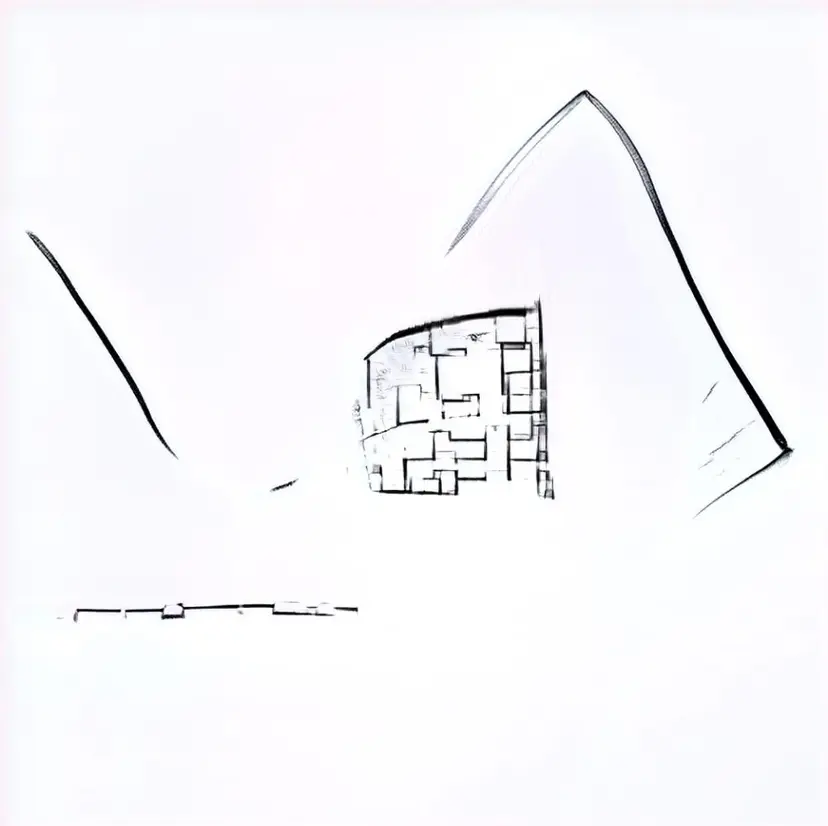
Drawing Scale Notation
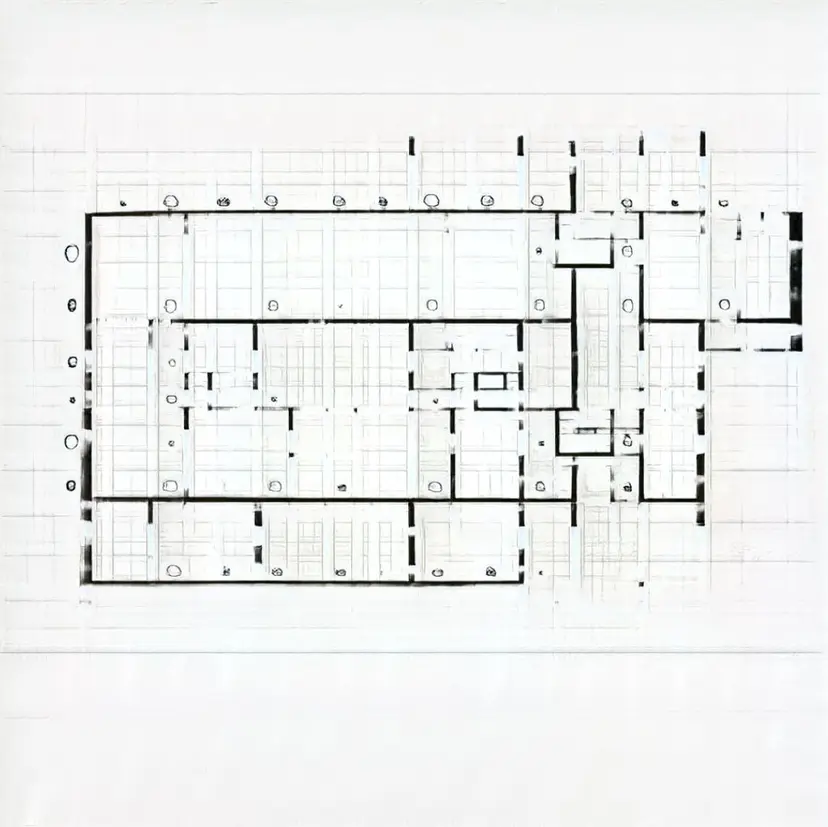
Section Cut Notation
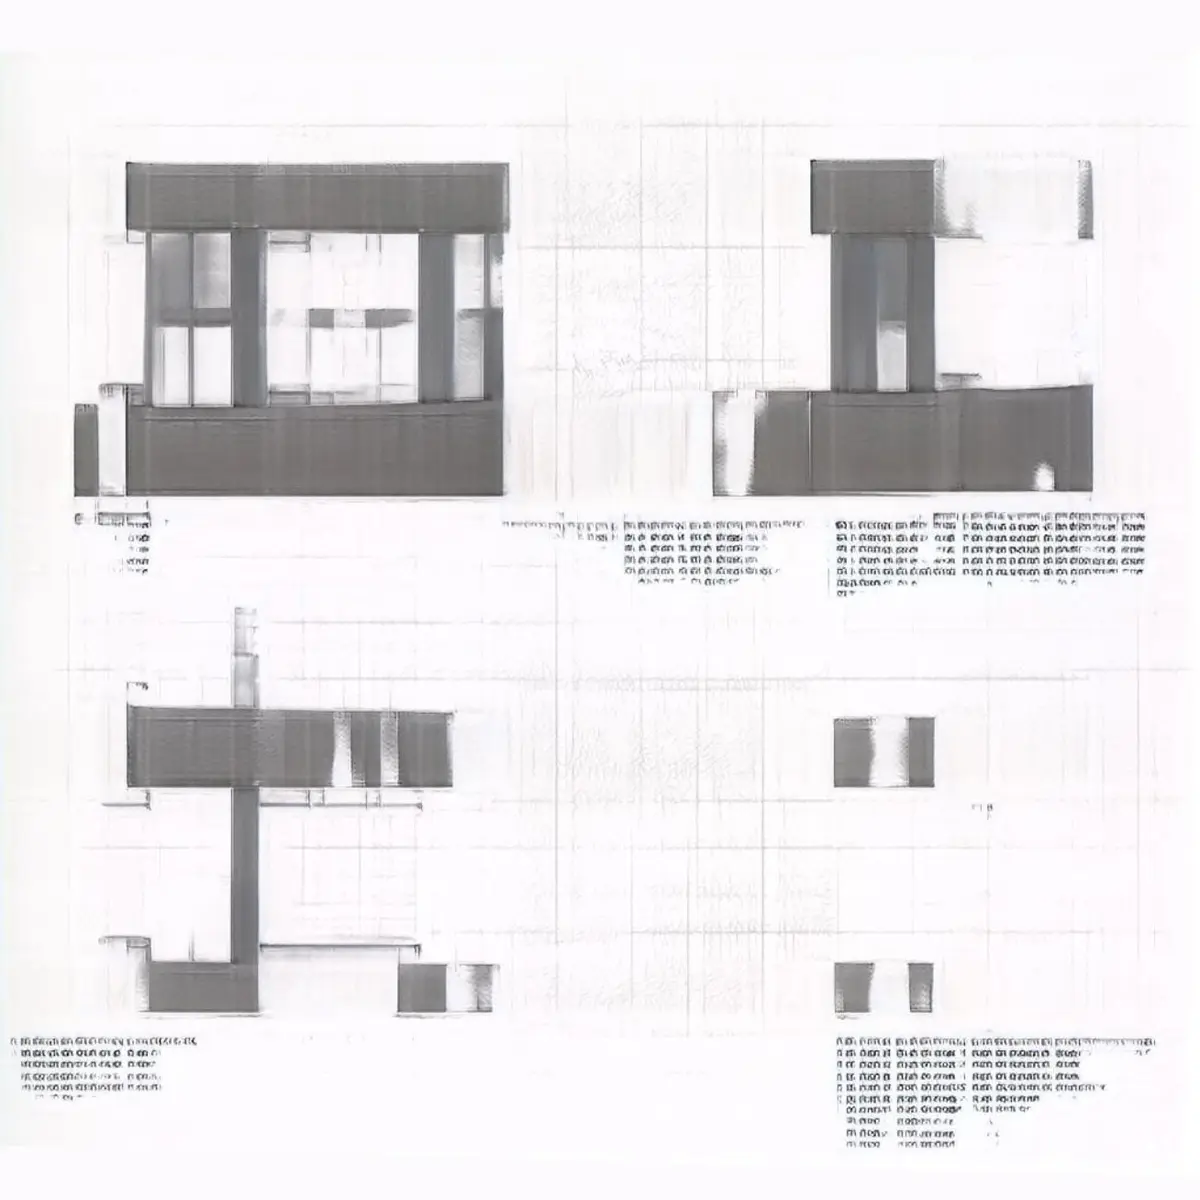
Paragraphs
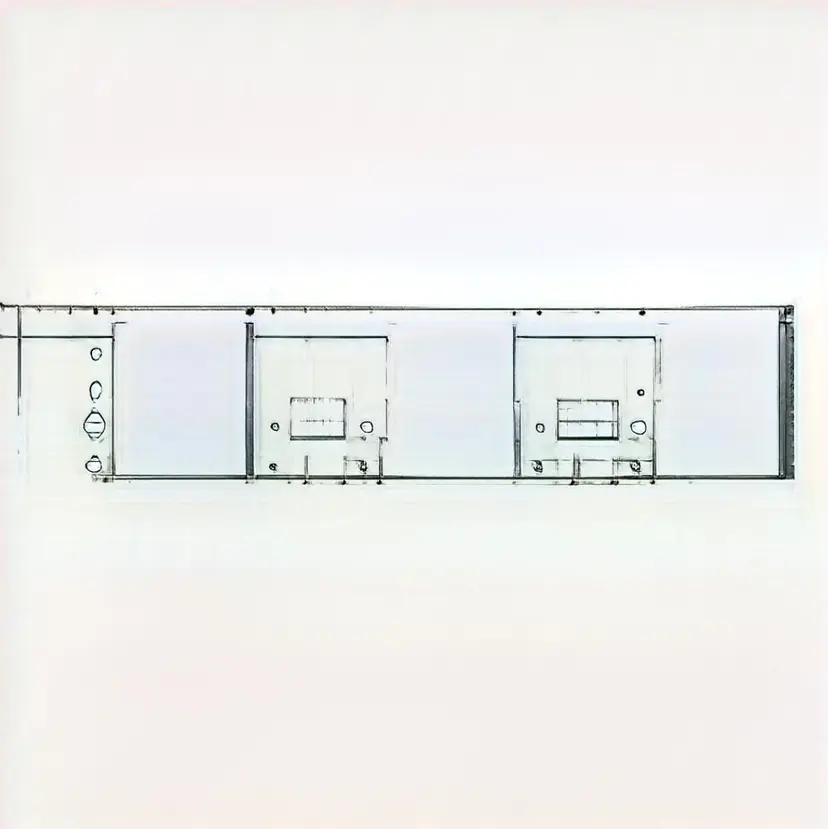
Duplication
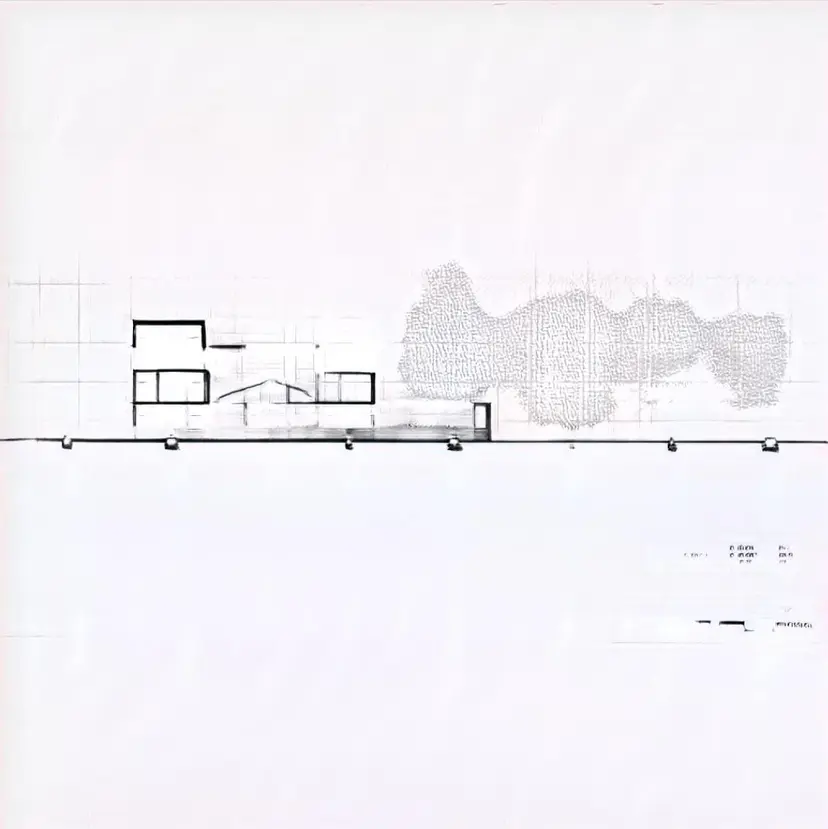
Footings
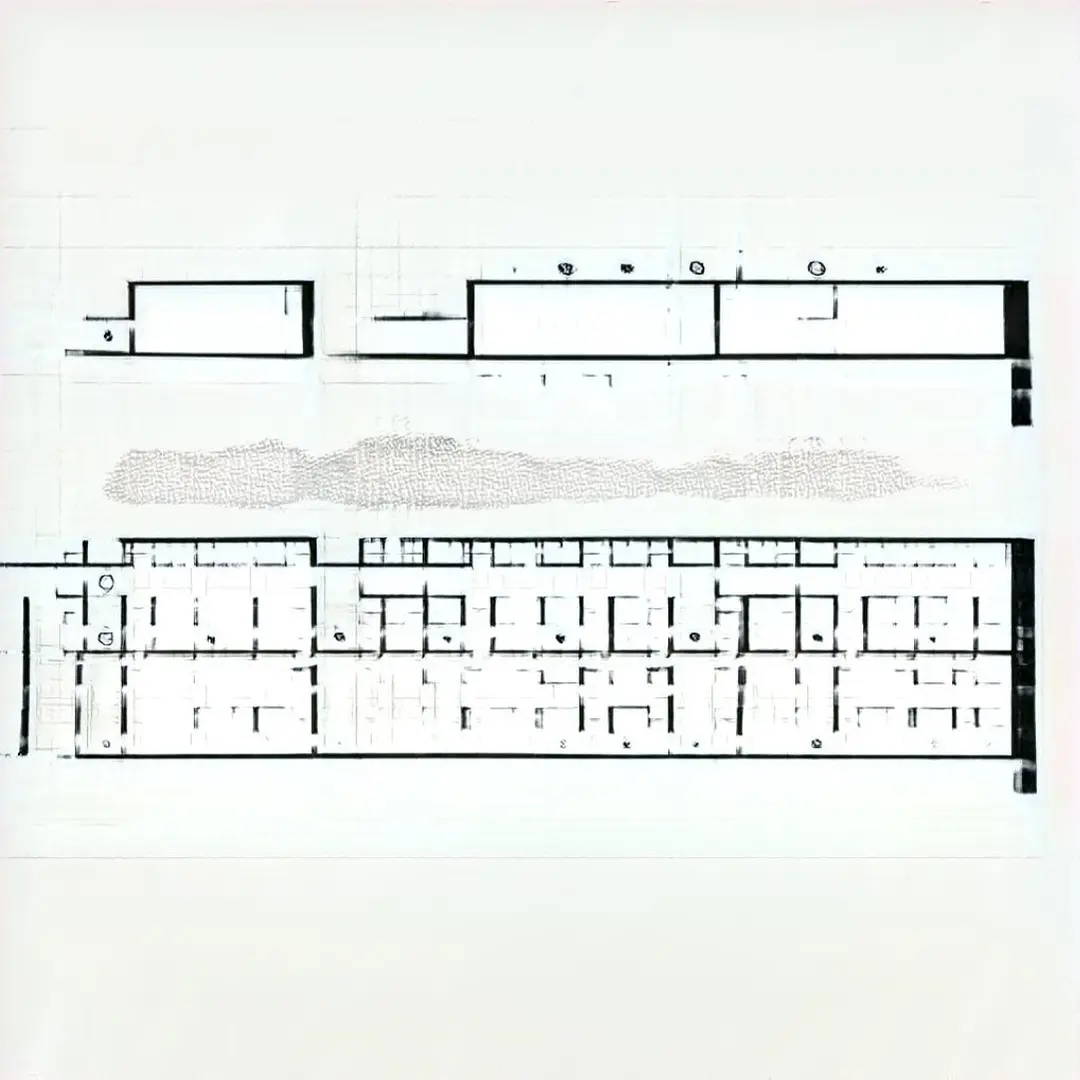
Plan and Section
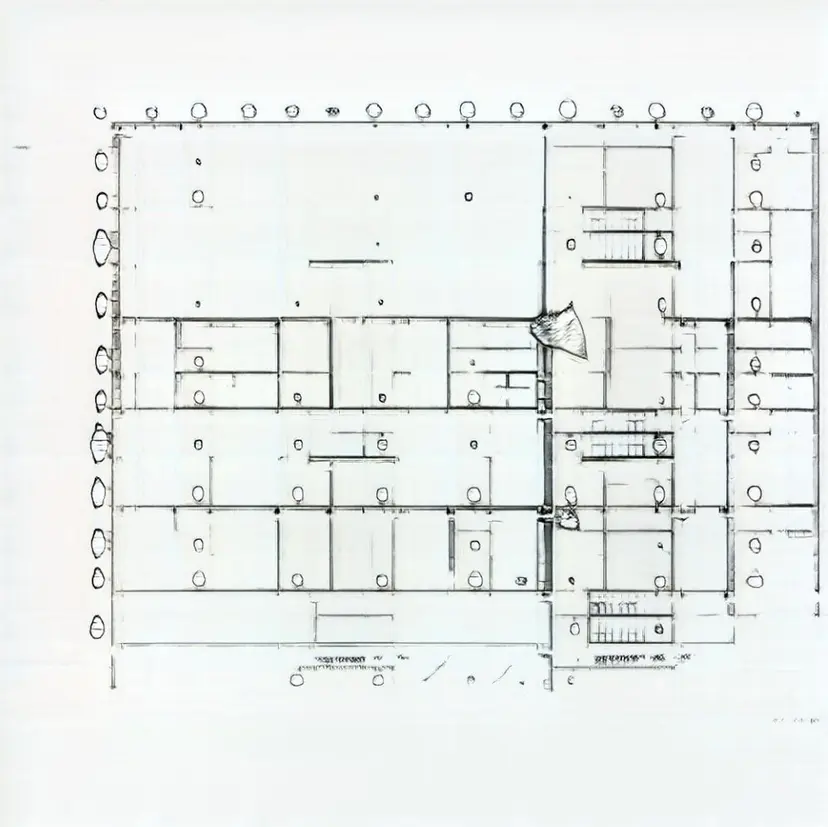
Egress Stairs
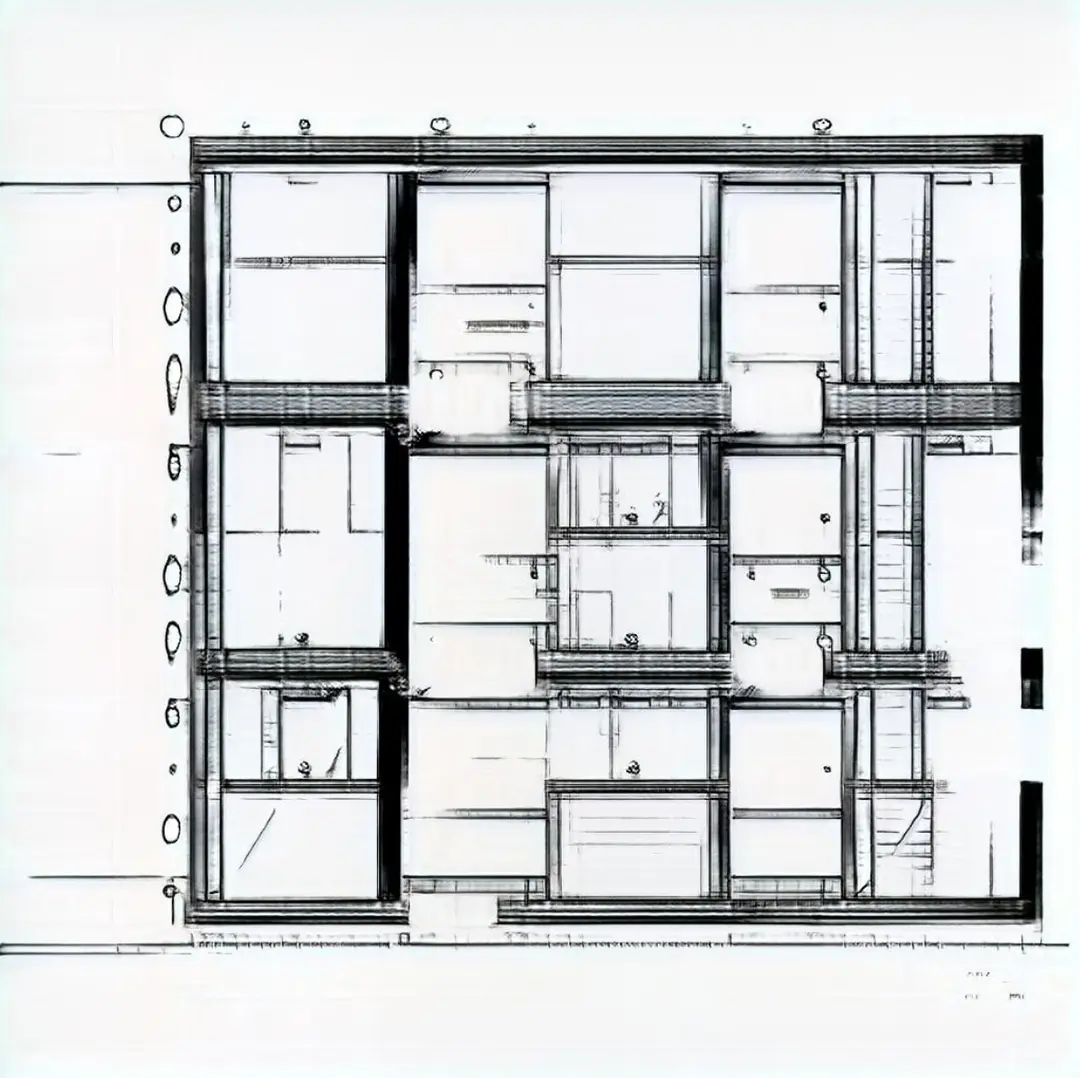
Beds
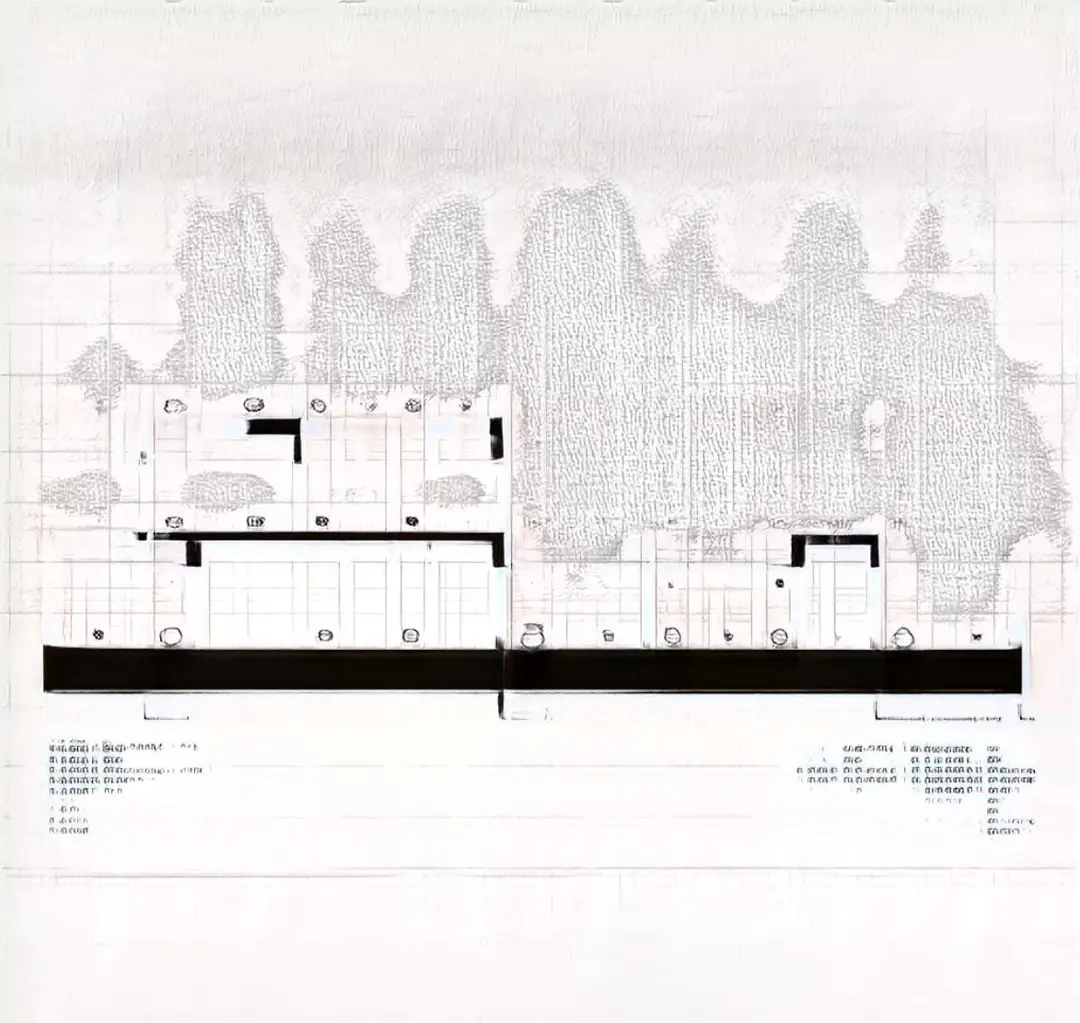
Trees
——— Embedding of the 220,000 Architectural drawings
